Uma Huggins
Hi, I'm Uma. I love turning messy data into something people can trust and explore: the pipelines underneath, the maps and interactive sites on top, and lately the AI agents that help me build both. I'm happiest learning a new tool by shipping something real with it.
- ctzn-geo
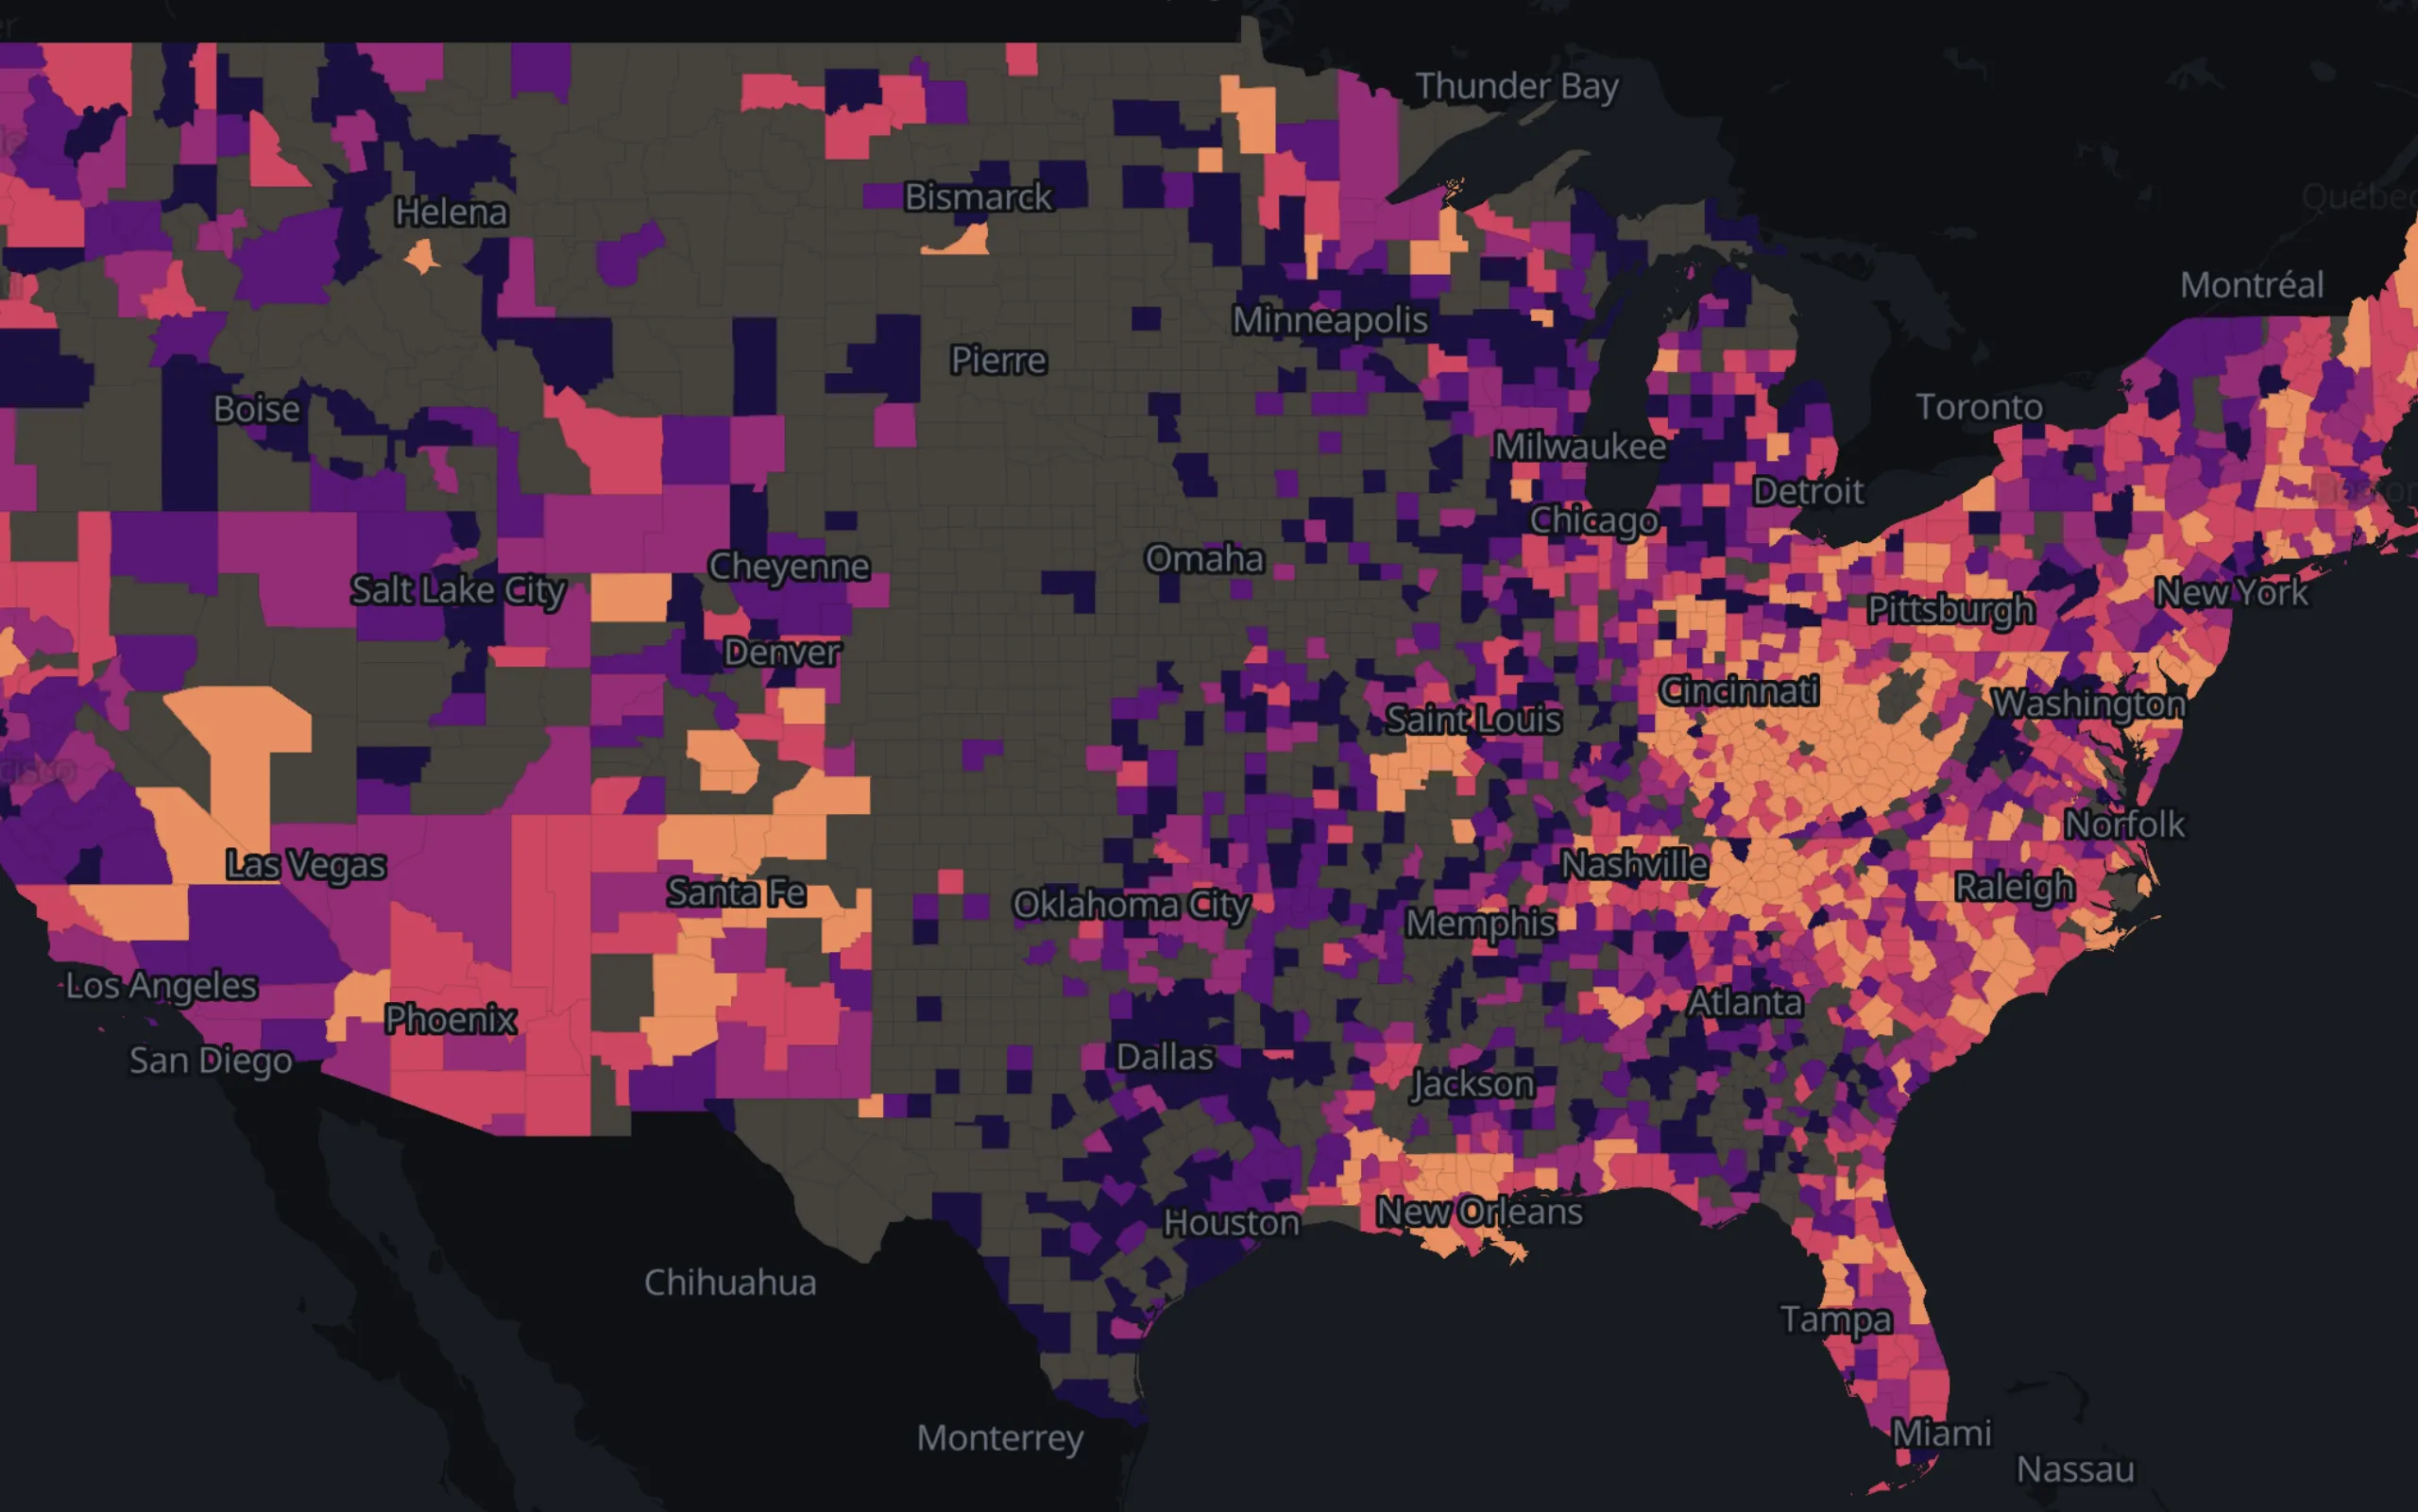
Live maps of U.S. metros at five nested census levels, every U.S. county with presidential returns, European regions (Eurostat NUTS 0-3) and world countries, built to show how choices of geography, classification, color and form change what the same data appears to say.
US, Europe, world
- CTZN Viz
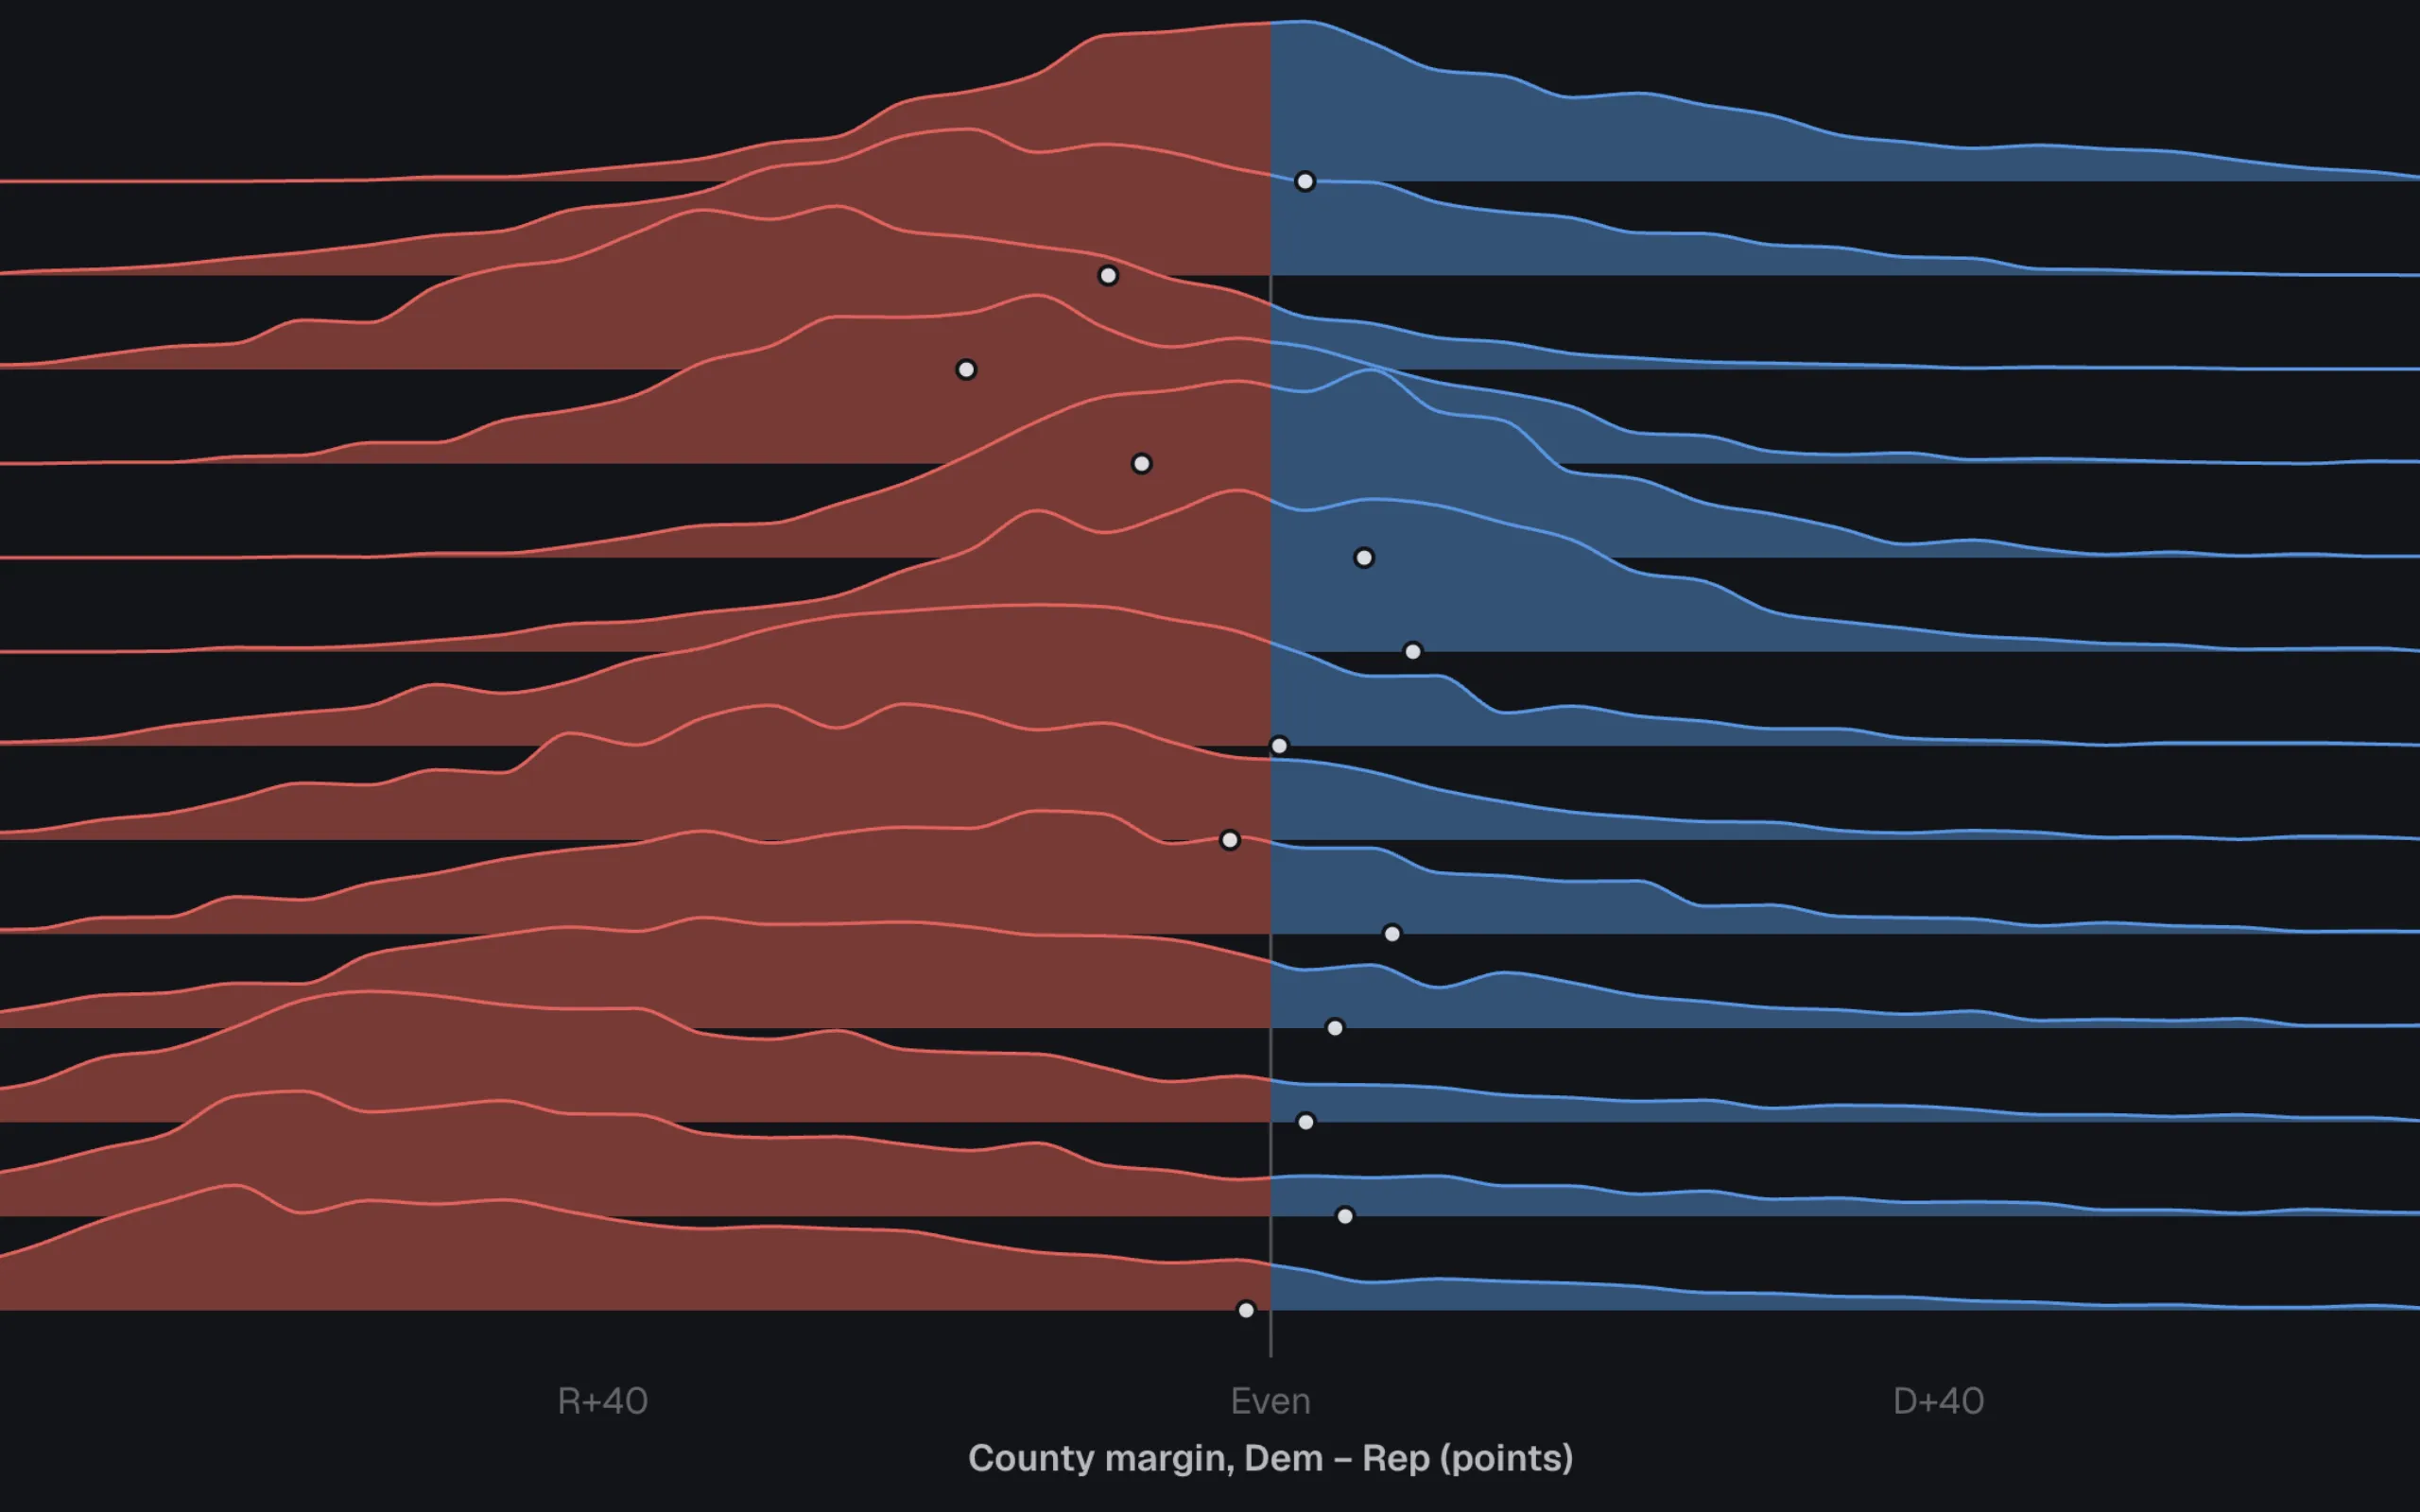
A gallery of 34 figures on American elections, campaign money, public opinion and health. Each makes one claim, gives the reader the control that would break it, and says what it cannot show; every chart behind them installs from the registry.
34 figures, 50 registry items
- chatFRED
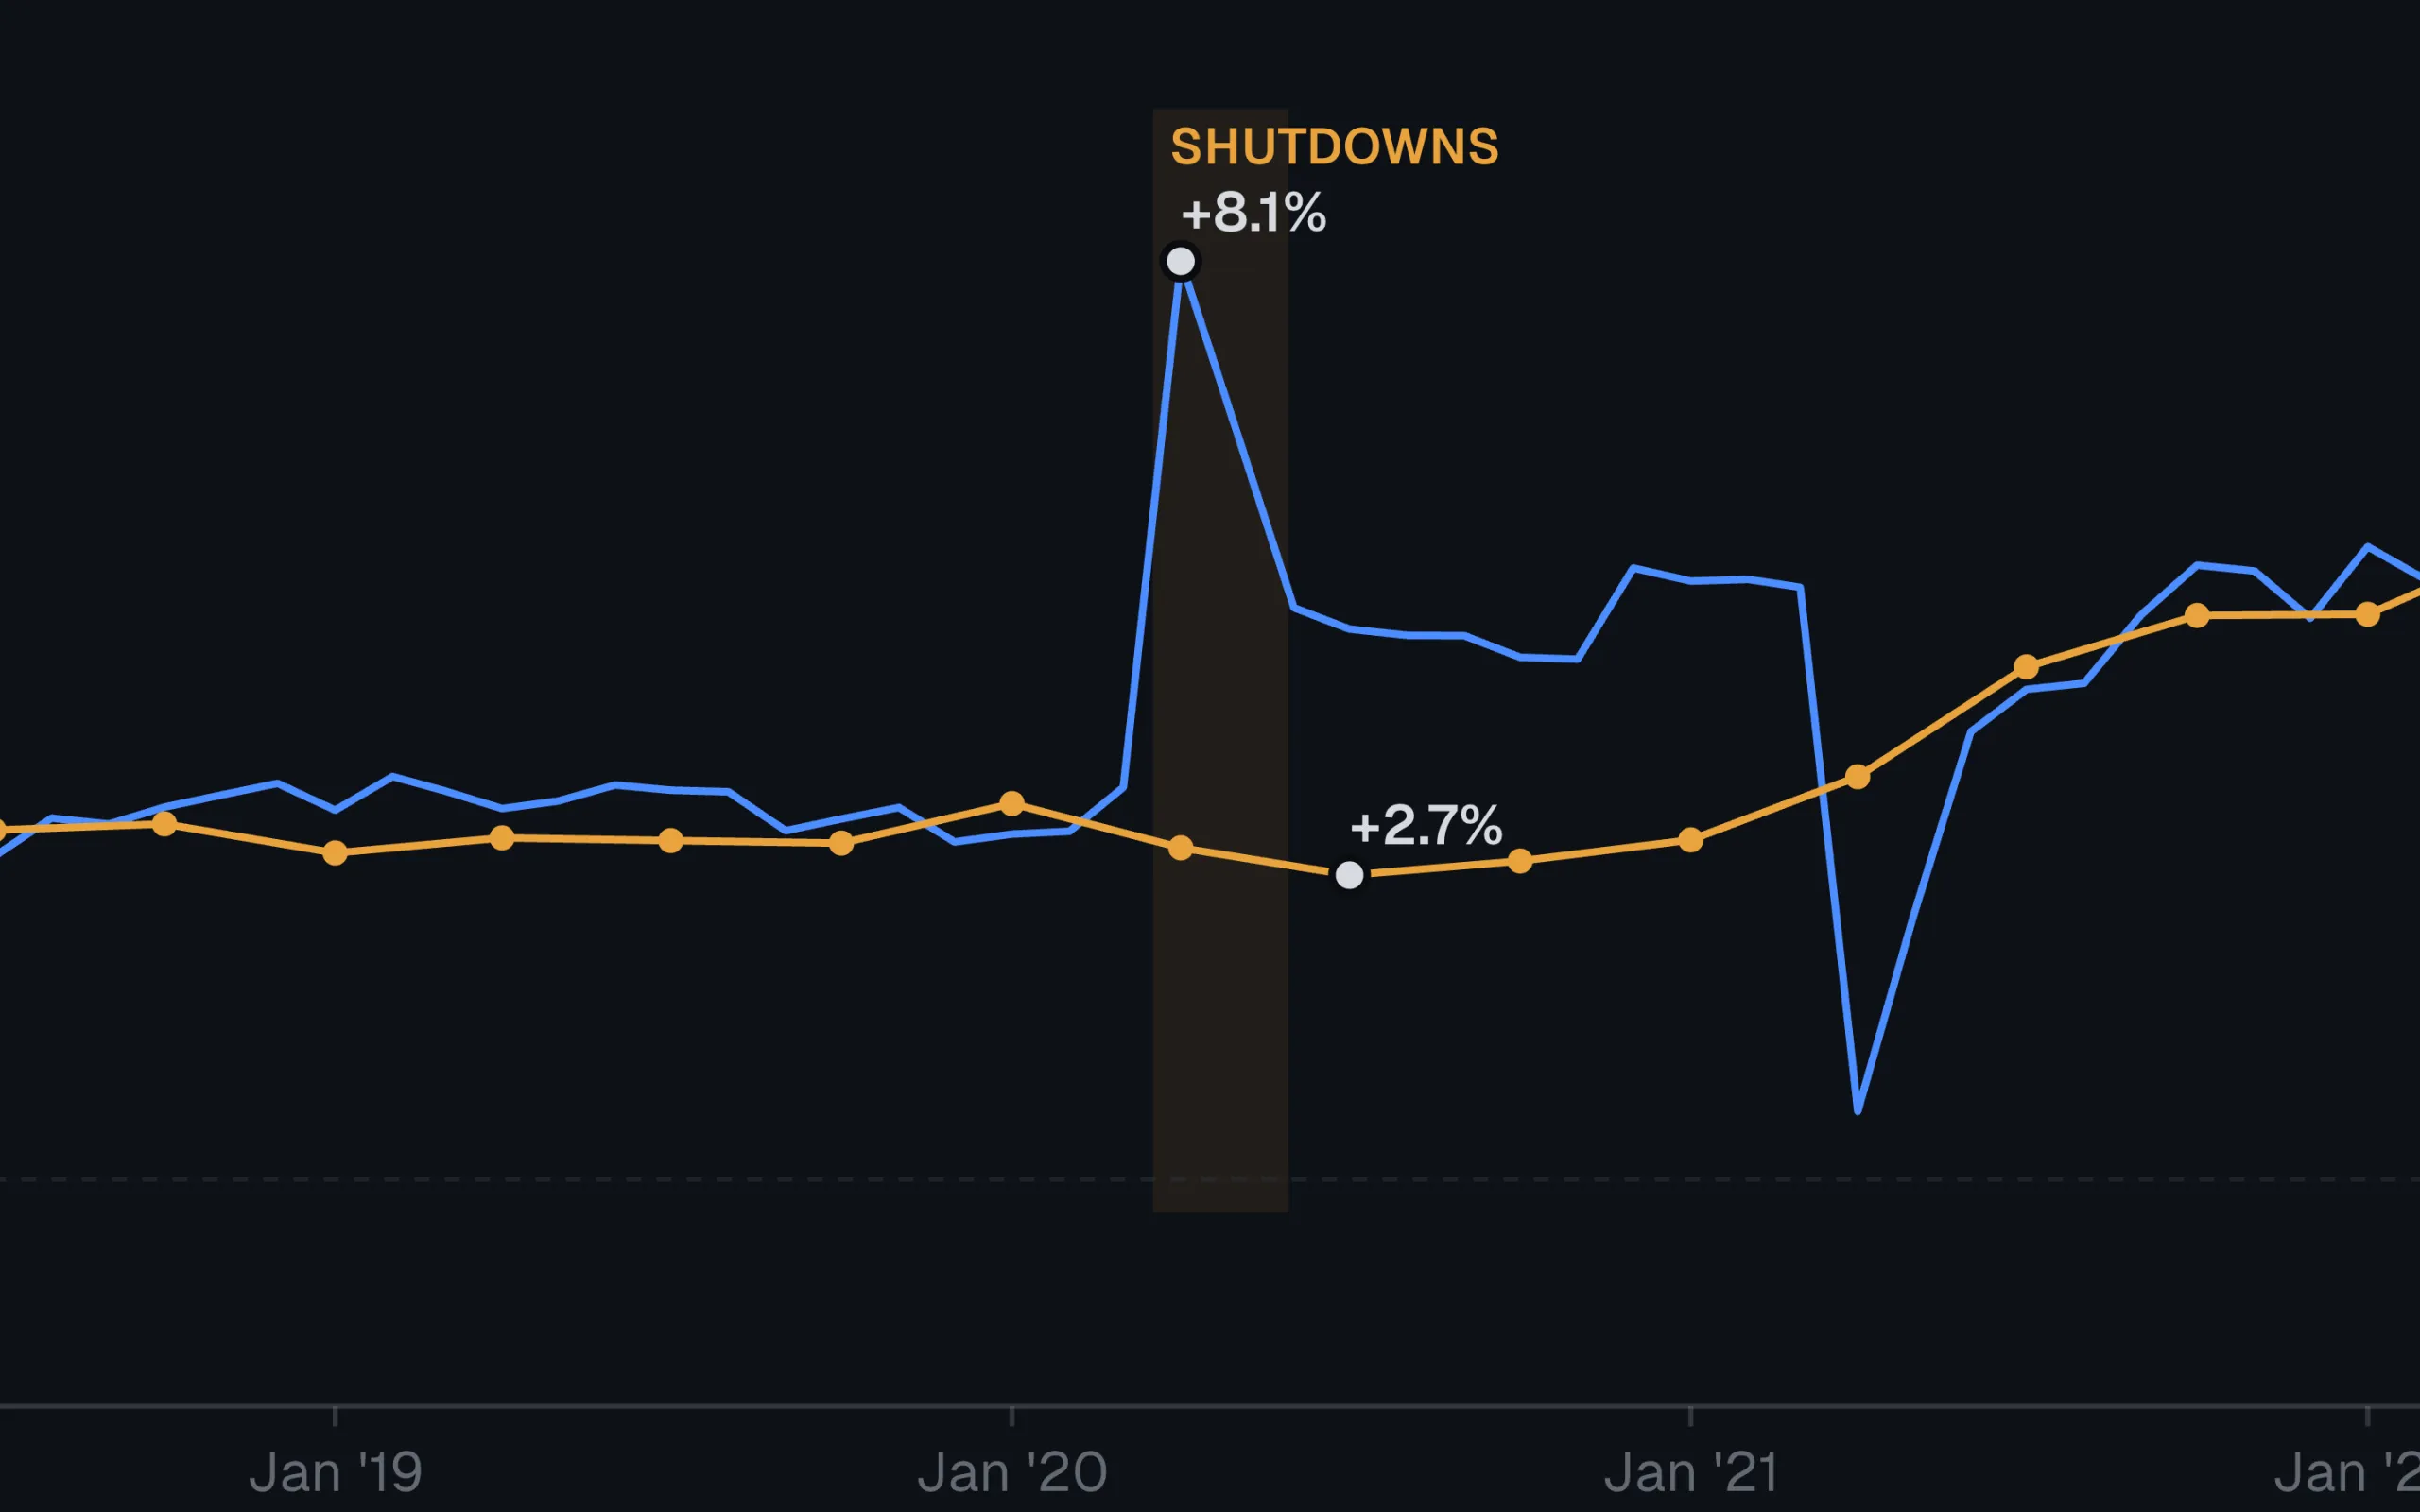
A chat terminal over 4,955 FRED series, with chart tools the model calls mid-conversation, and a Presidential Scoreboard that grades nineteen postwar terms on six indicators, percentile-ranked on the curve.
4,955 FRED series
- College Ledger
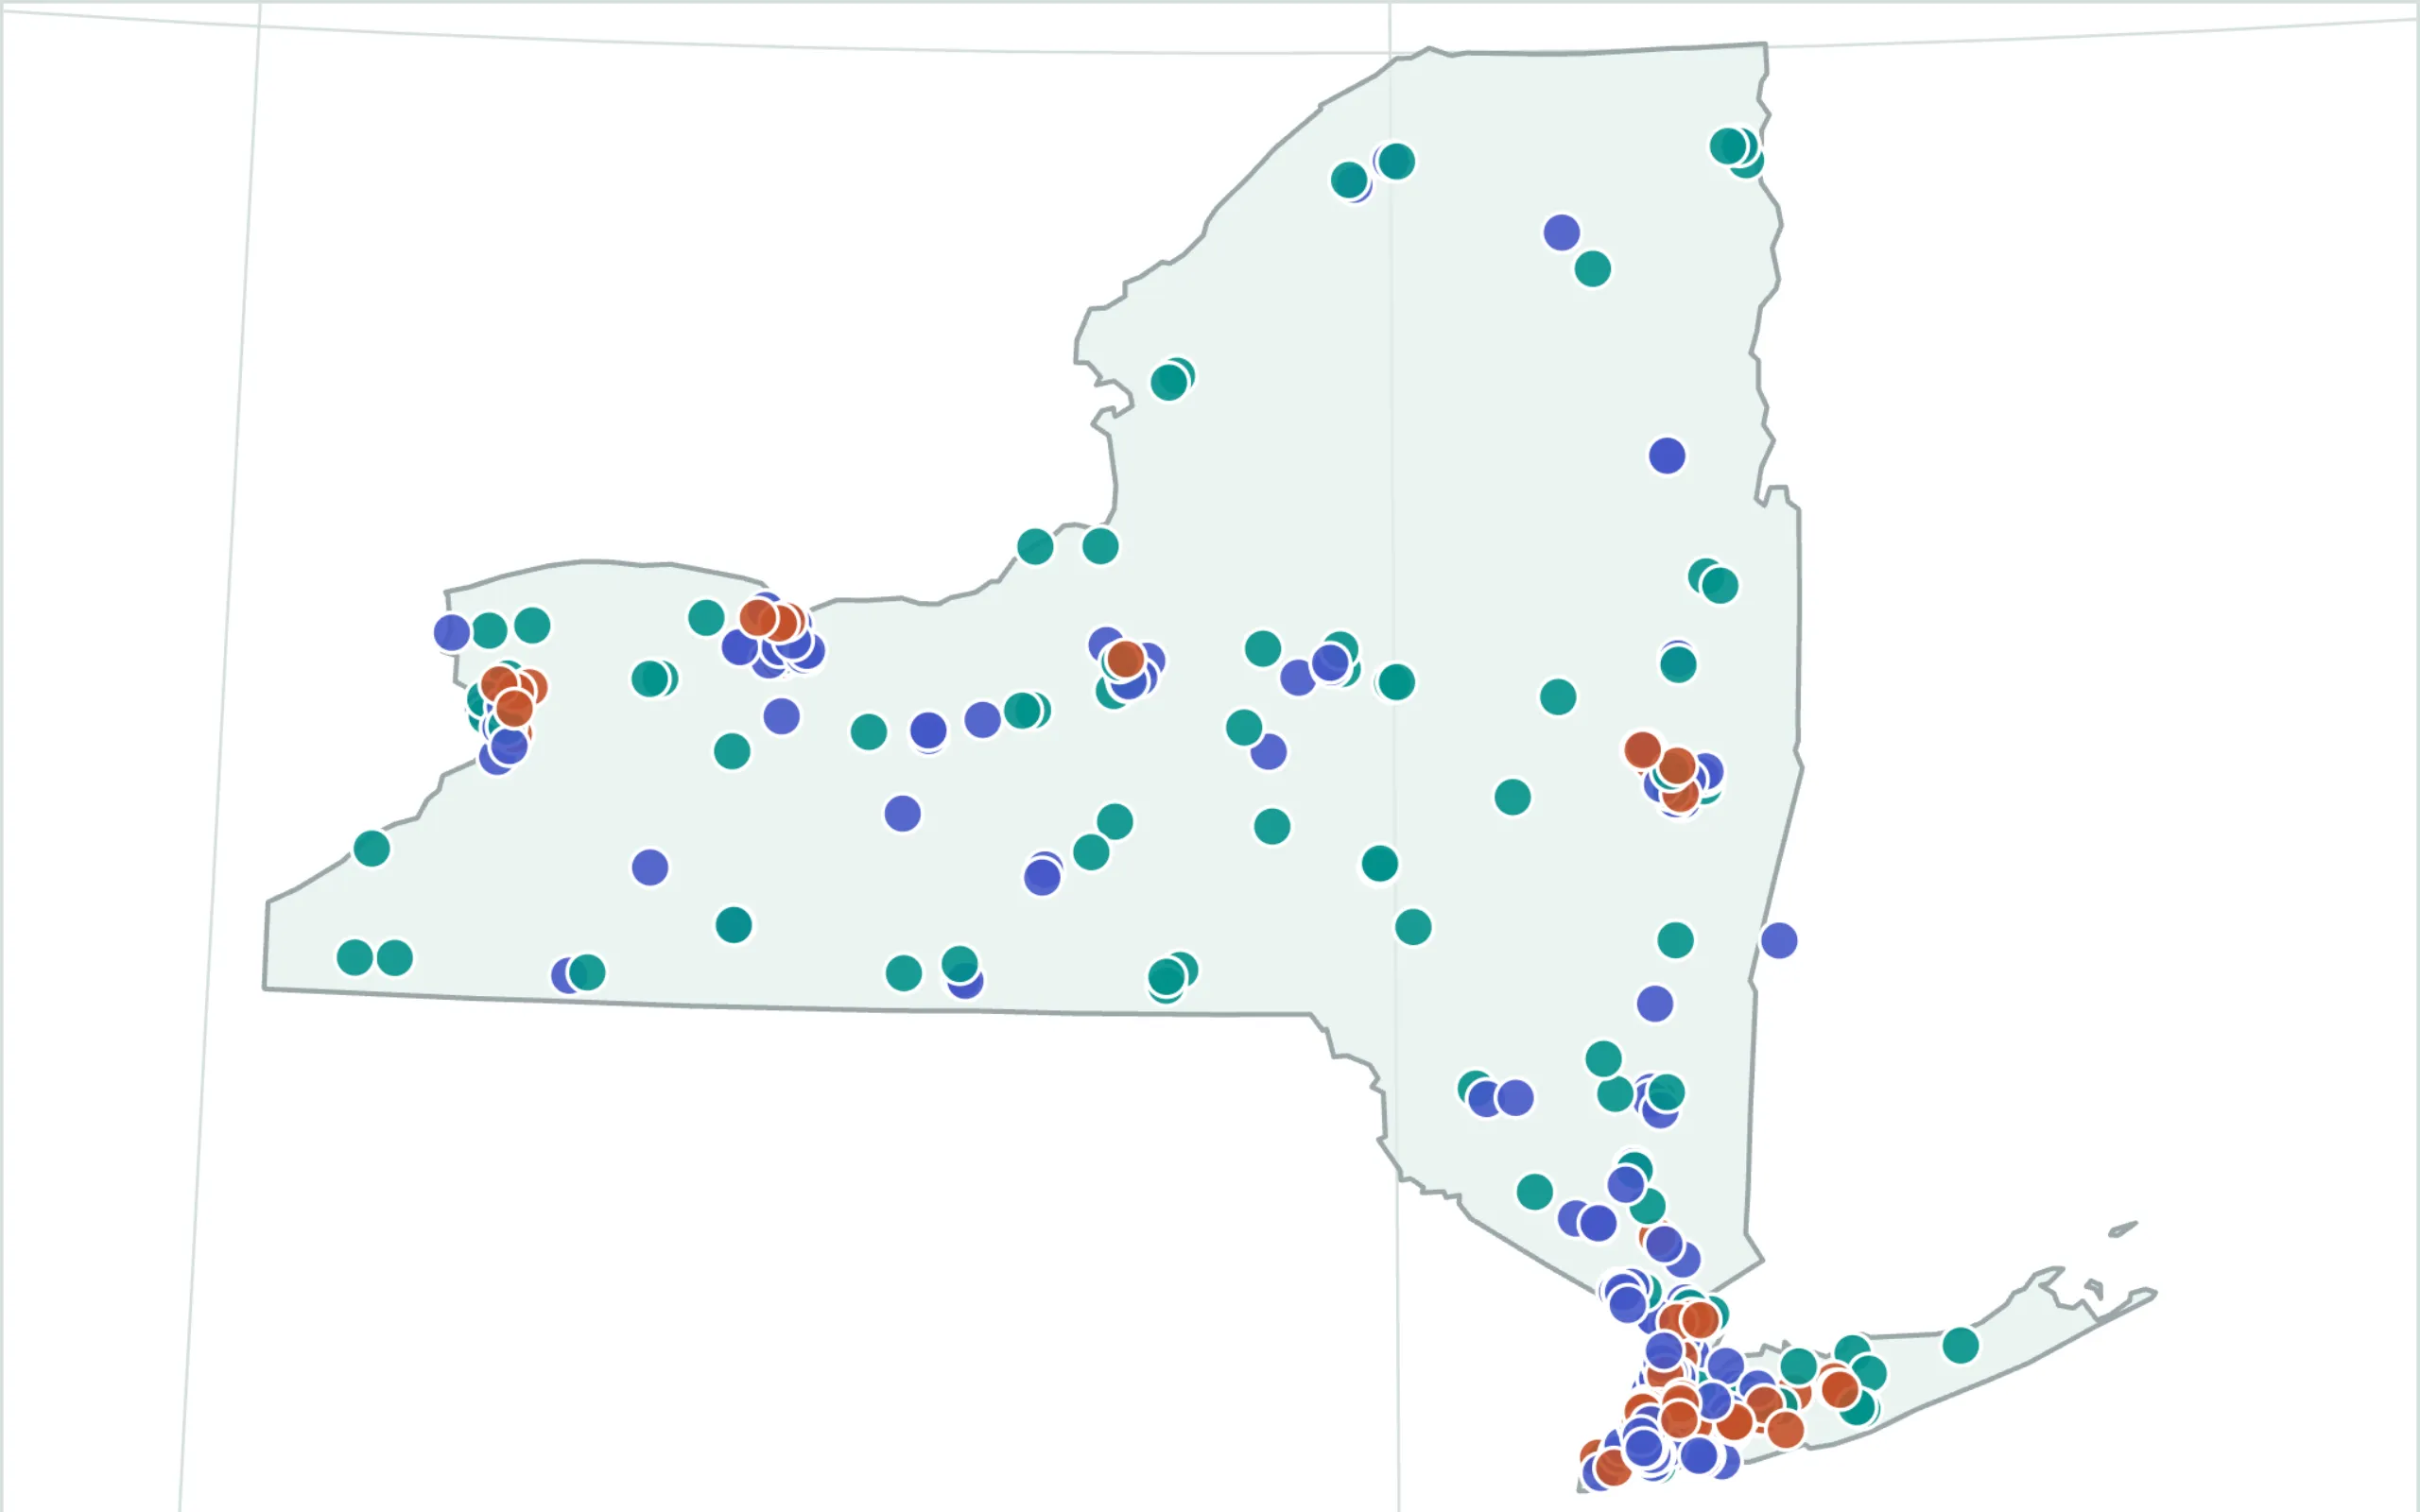
A profile page for every U.S. higher-ed institution in the Department of Education's College Scorecard: net price by income, completion and earnings, thirty years of trend data, joined against IPEDS.
6,273 institution pages
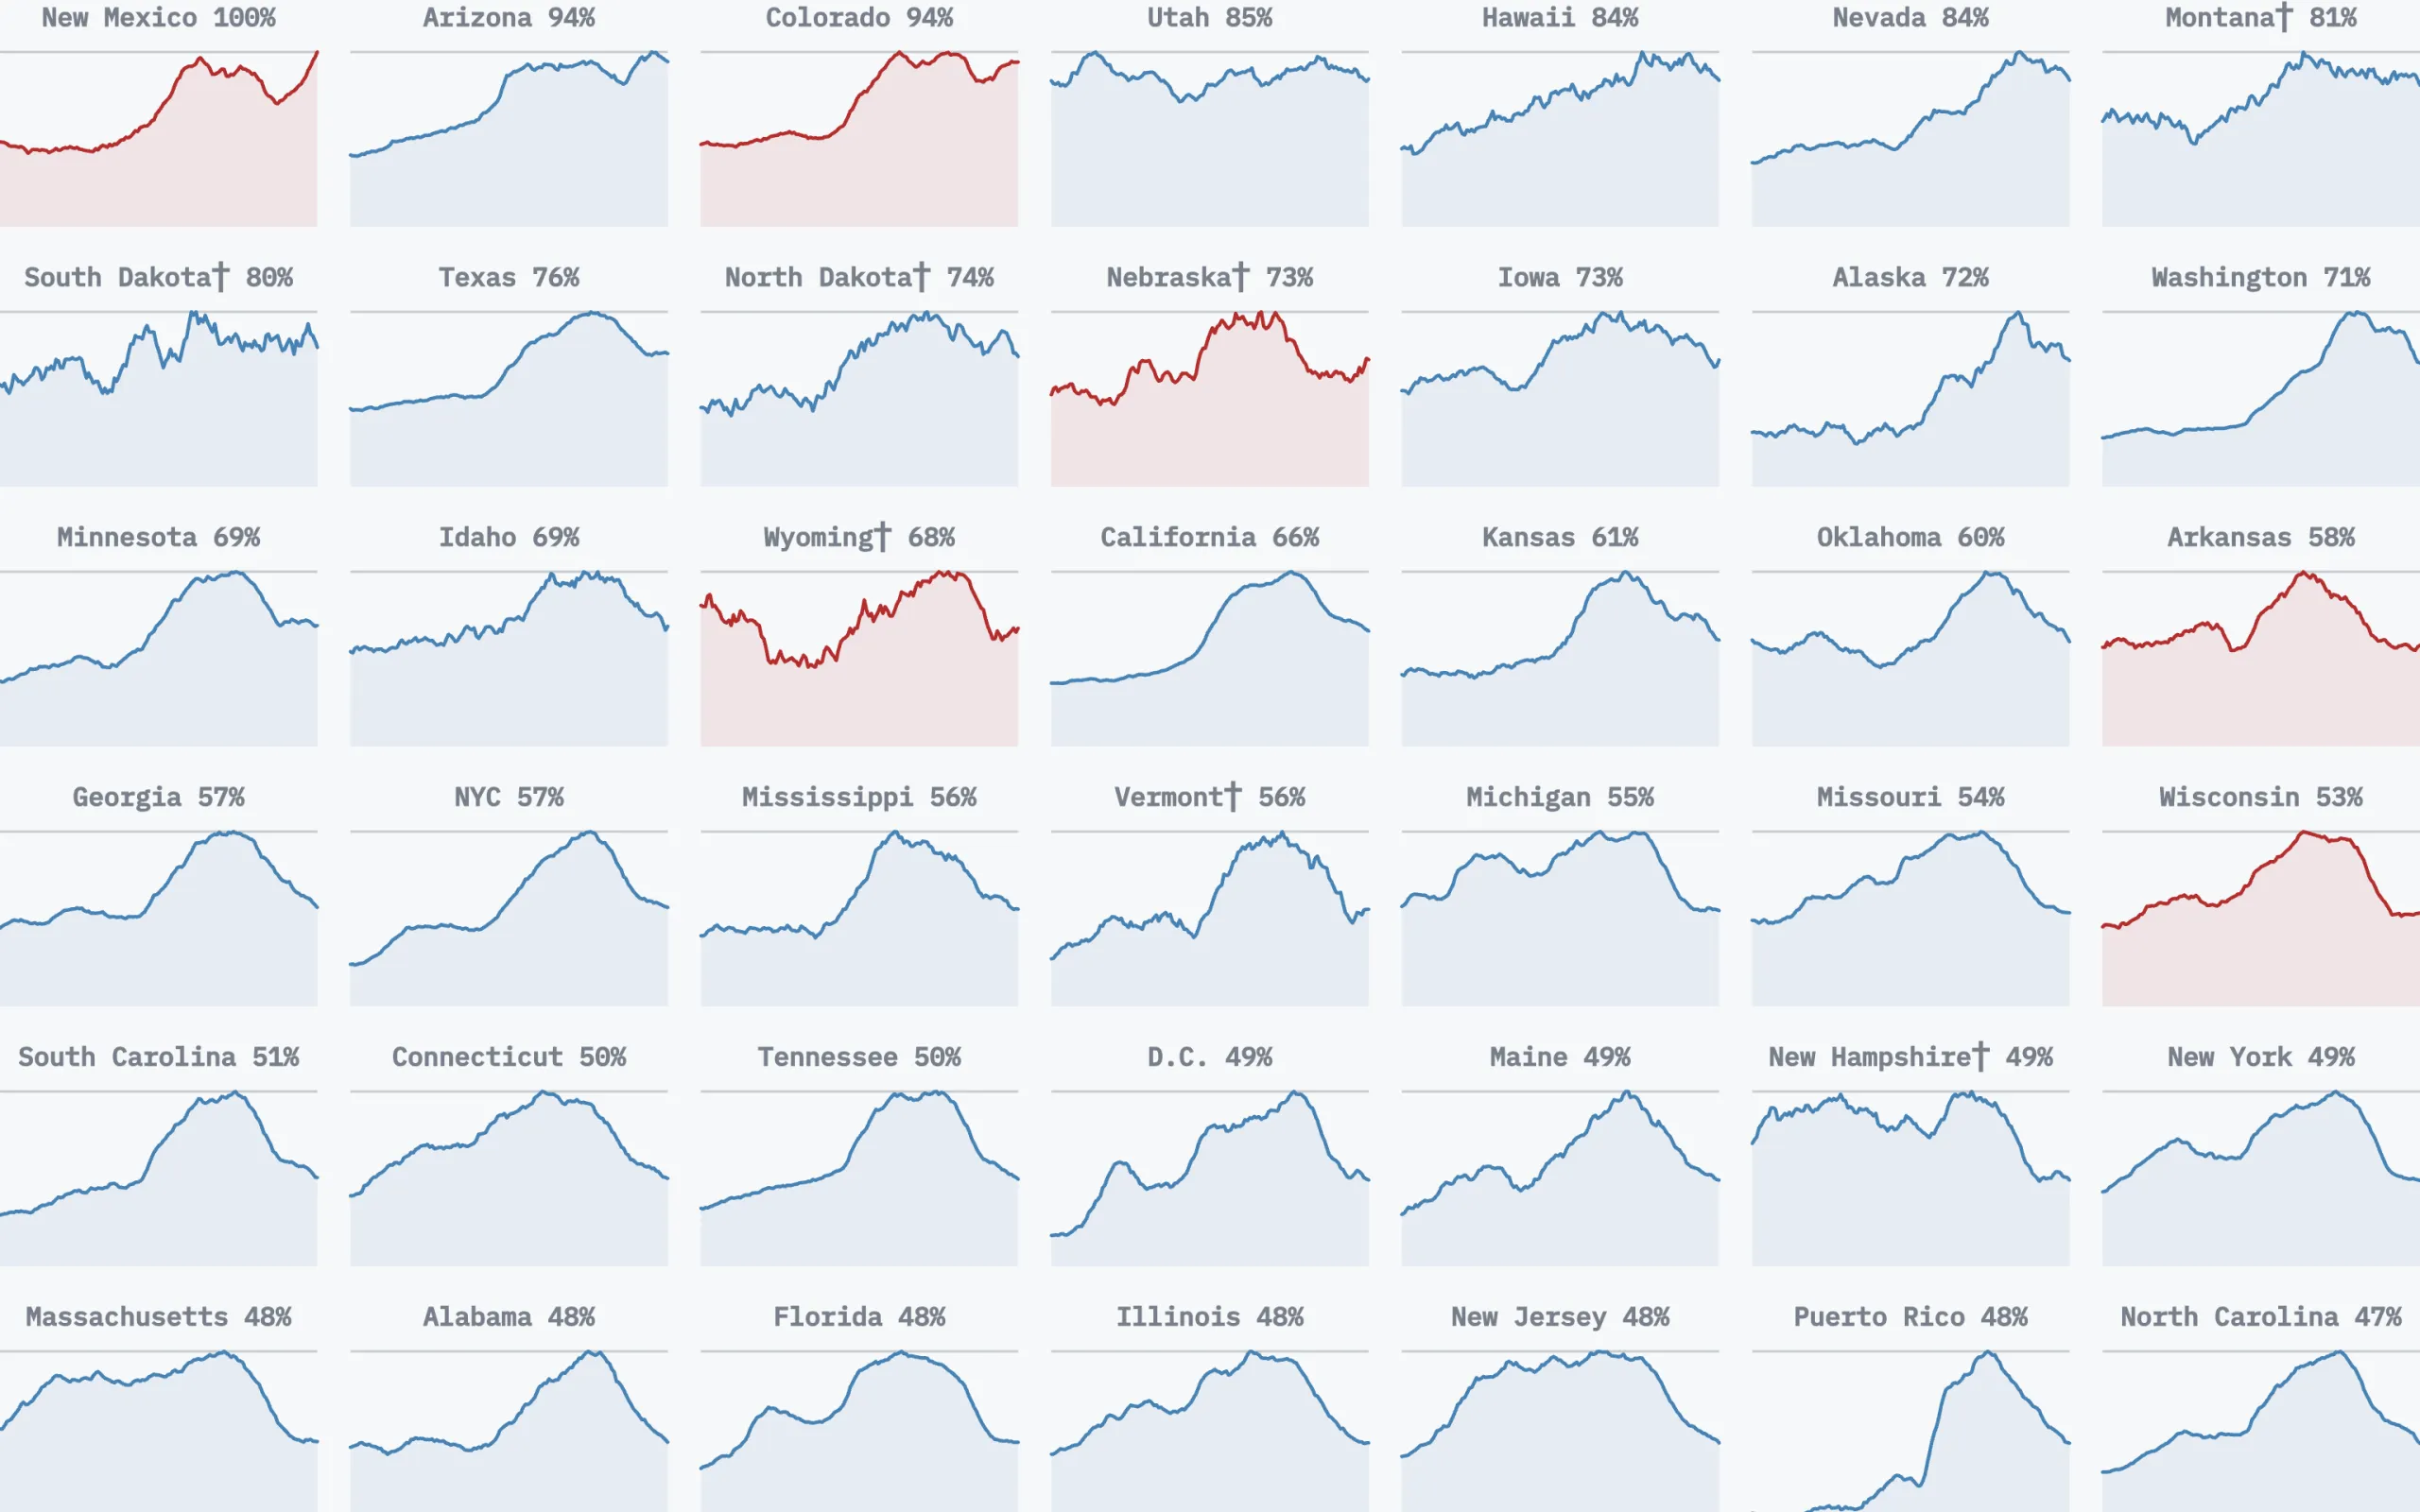
- Health of America's ZIP Codes
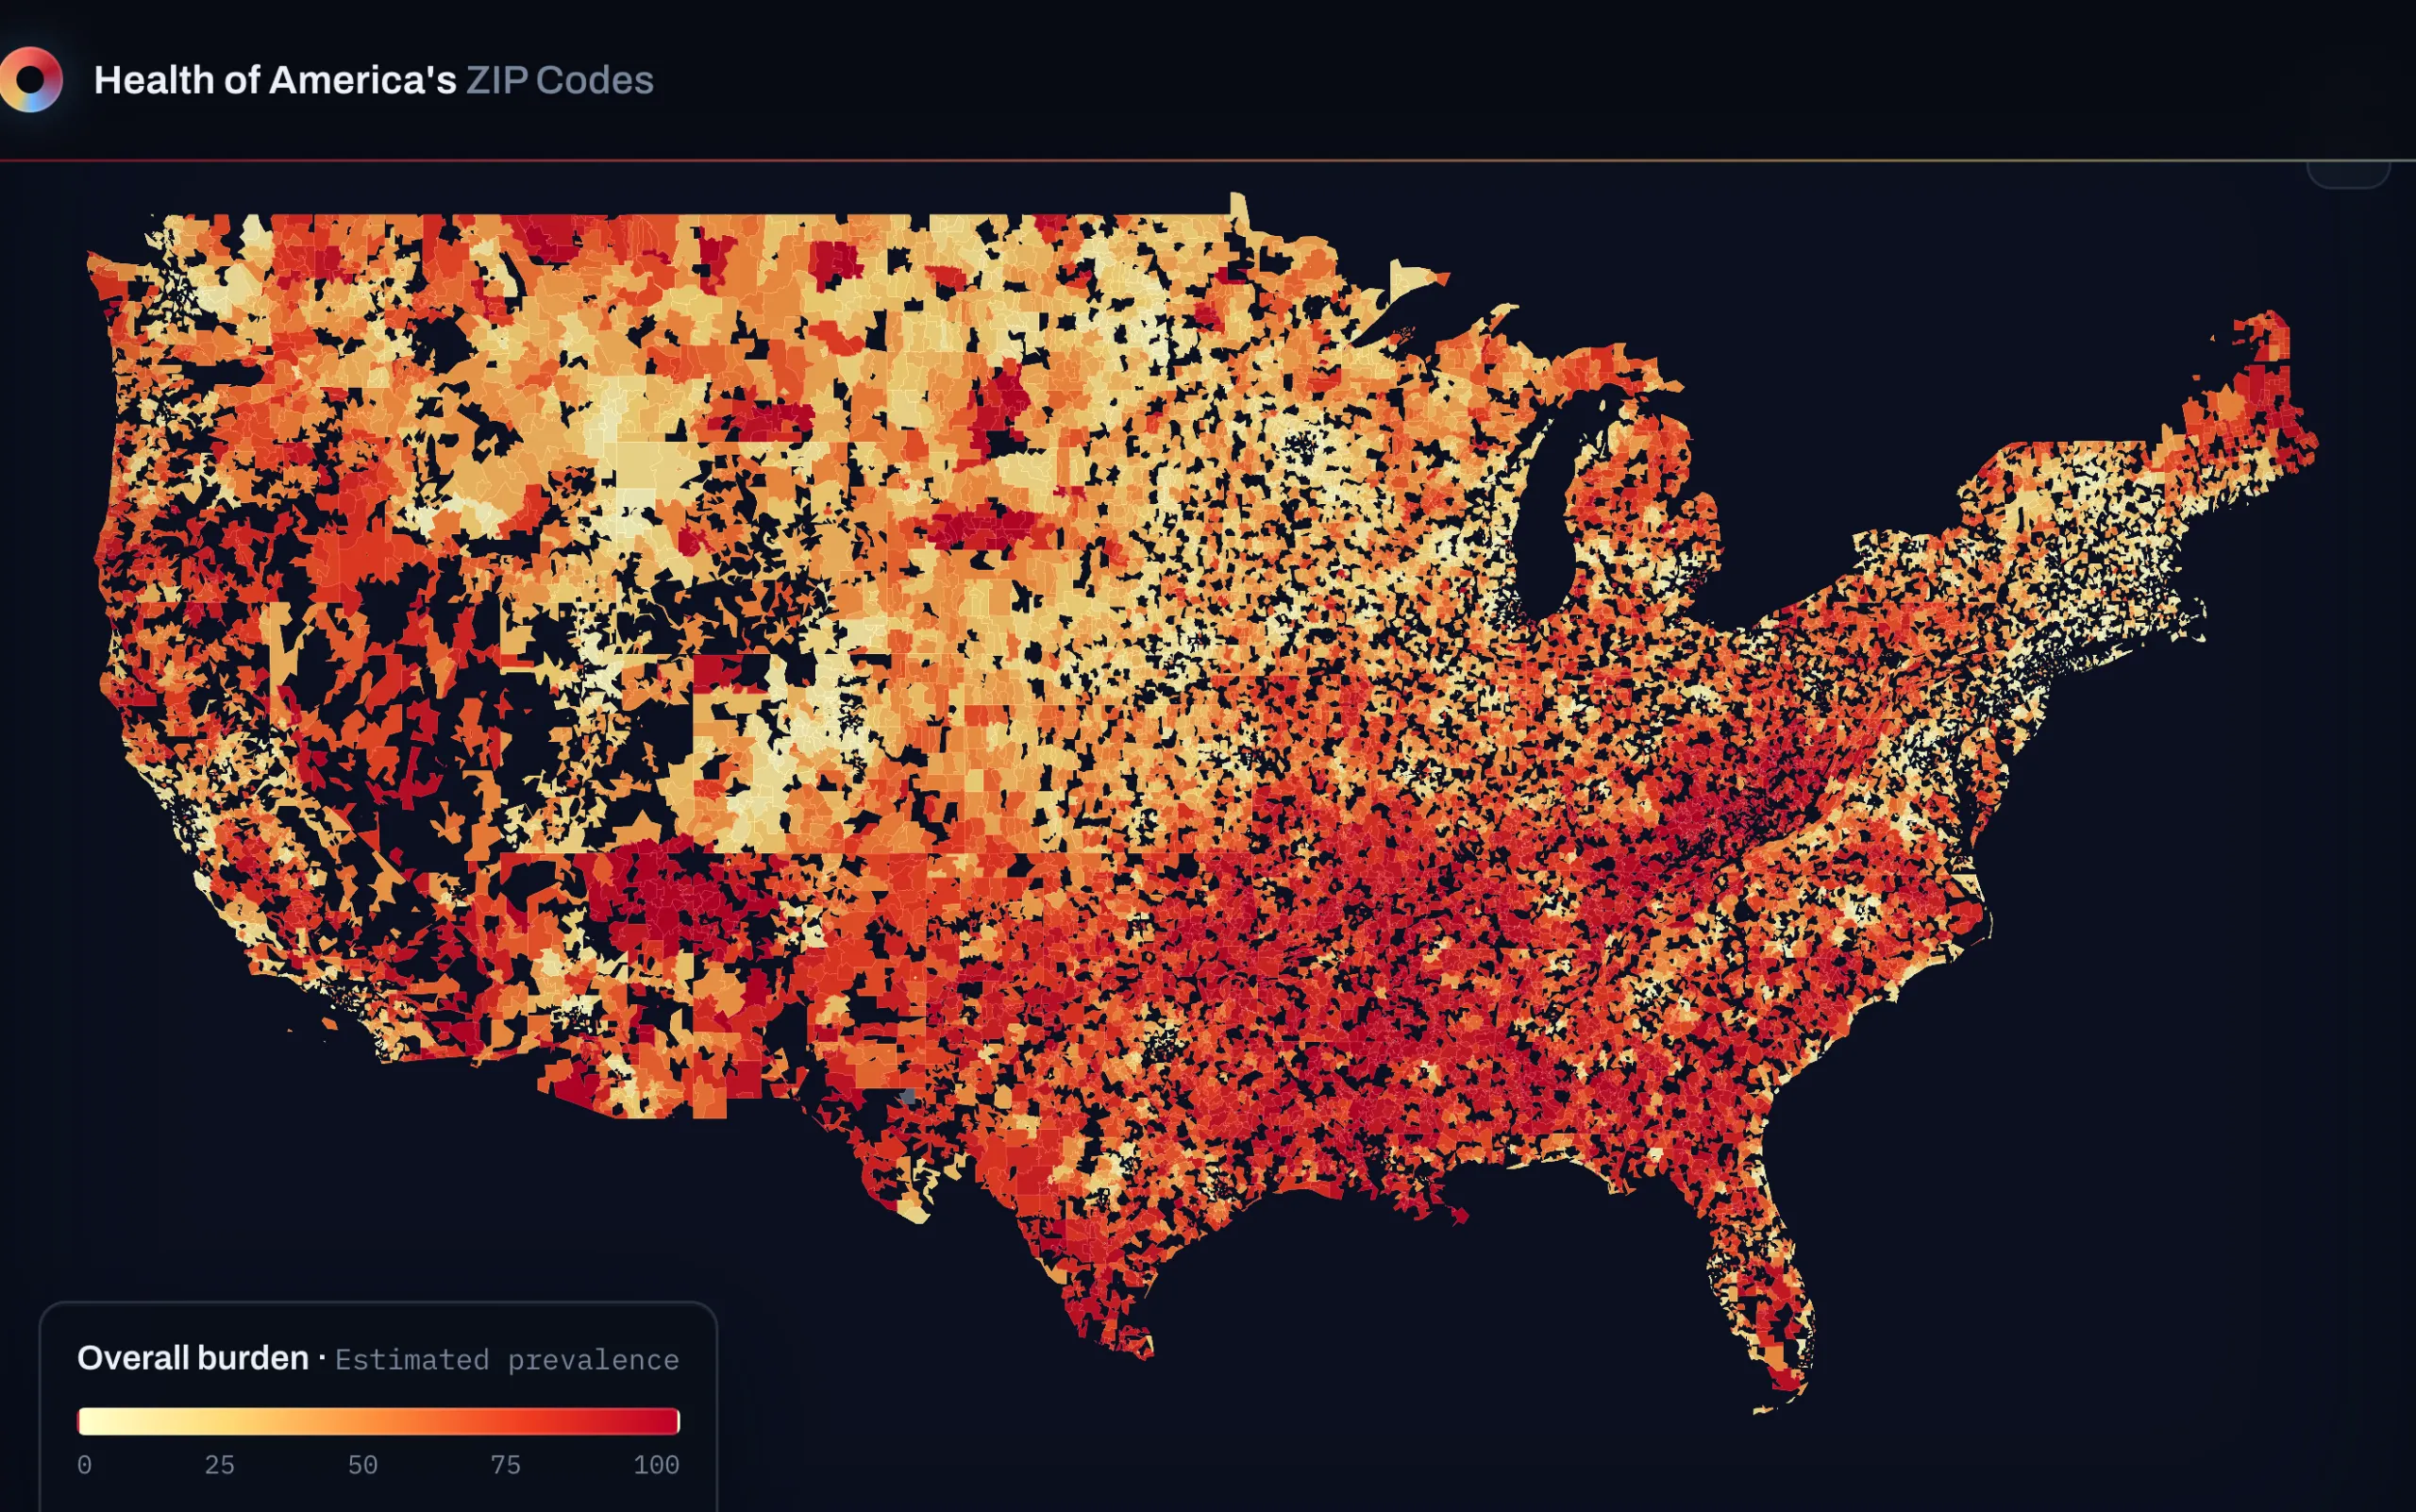
A ZIP-code-level atlas of health outcomes, deprivation, and demographics: CDC PLACES estimates, the Area Deprivation Index, ACS, and two political layers, joined into one parquet.
32,409 ZIP/ZCTA rows
- The American Political Almanac
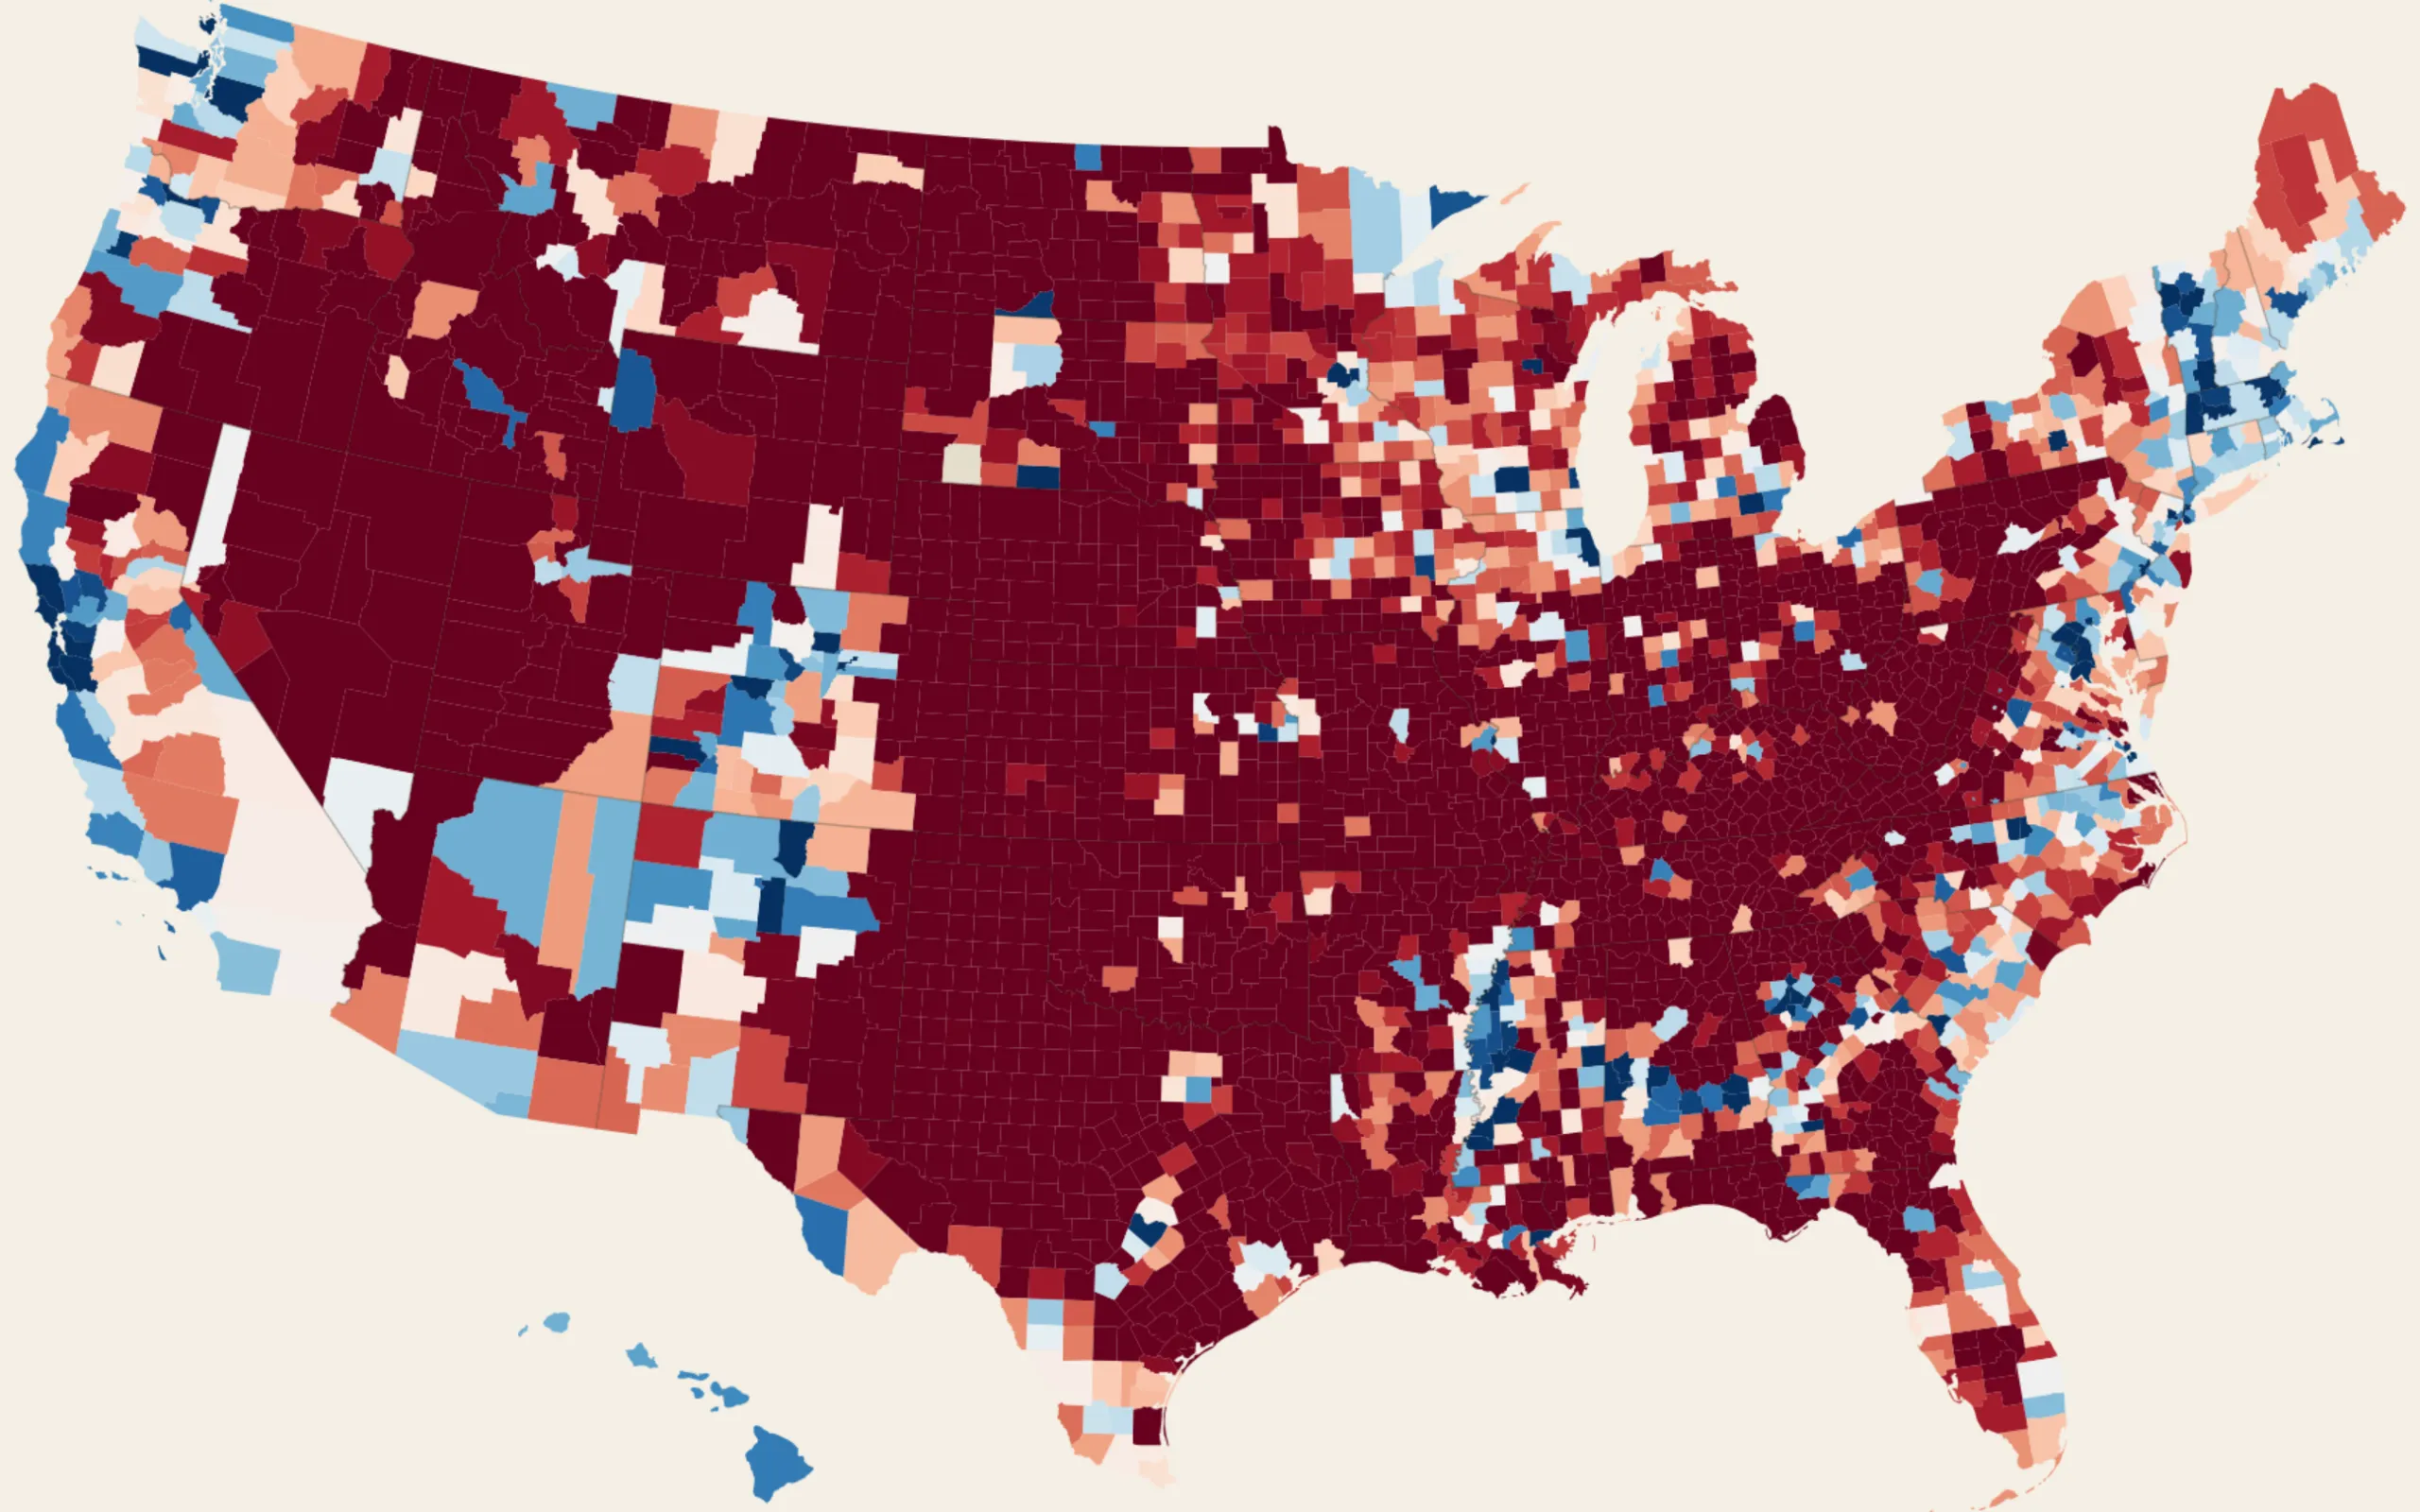
Every U.S. presidential election since 1868, county by county: 116,909 county-year records, a dual-mode cartogram and geographic choropleth, five era essays, and a page for every one of 76 candidates with a licensed portrait.
3,172 counties, 40 elections
- The Reversal